Skyline Pulse is a lightweight weekly ledger for worship and production teams — attendance, unity, engagement, room experience, service flow, and tech readiness, logged in under a minute and pulled straight from your Planning Center Plans.
No more digging through texts and spreadsheets to remember how loud 11:00 ran, who was running camera, or who filled in the details for a given Sunday. Pulse makes it a 60-second habit.
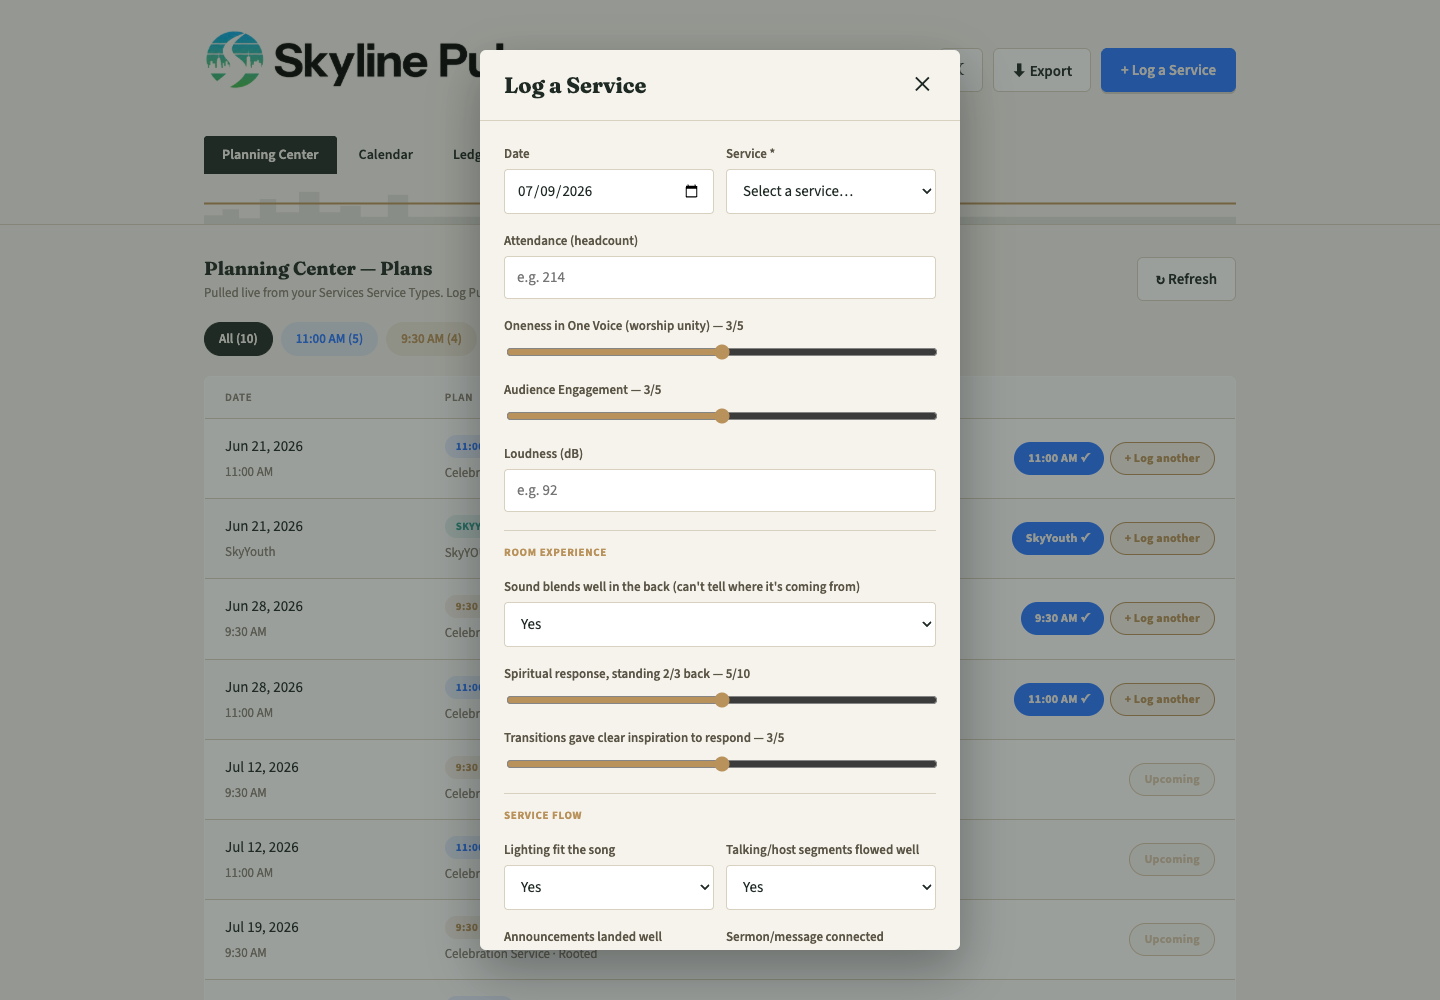
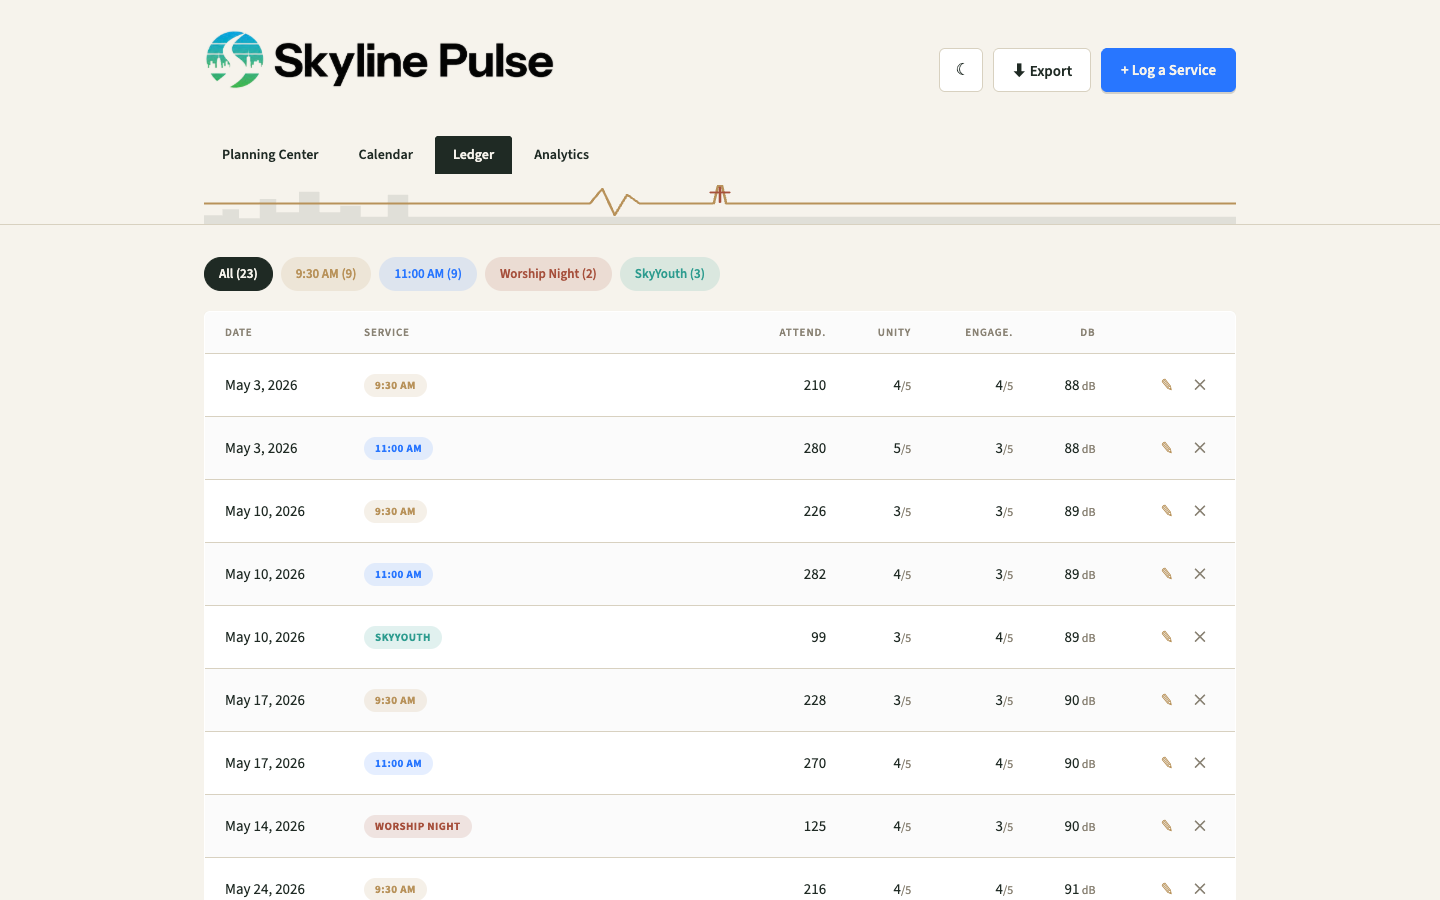
Attendance, worship unity, audience engagement, and loudness (dB) for every service — logged straight from its Planning Center Plan, reviewed and edited from the Calendar.
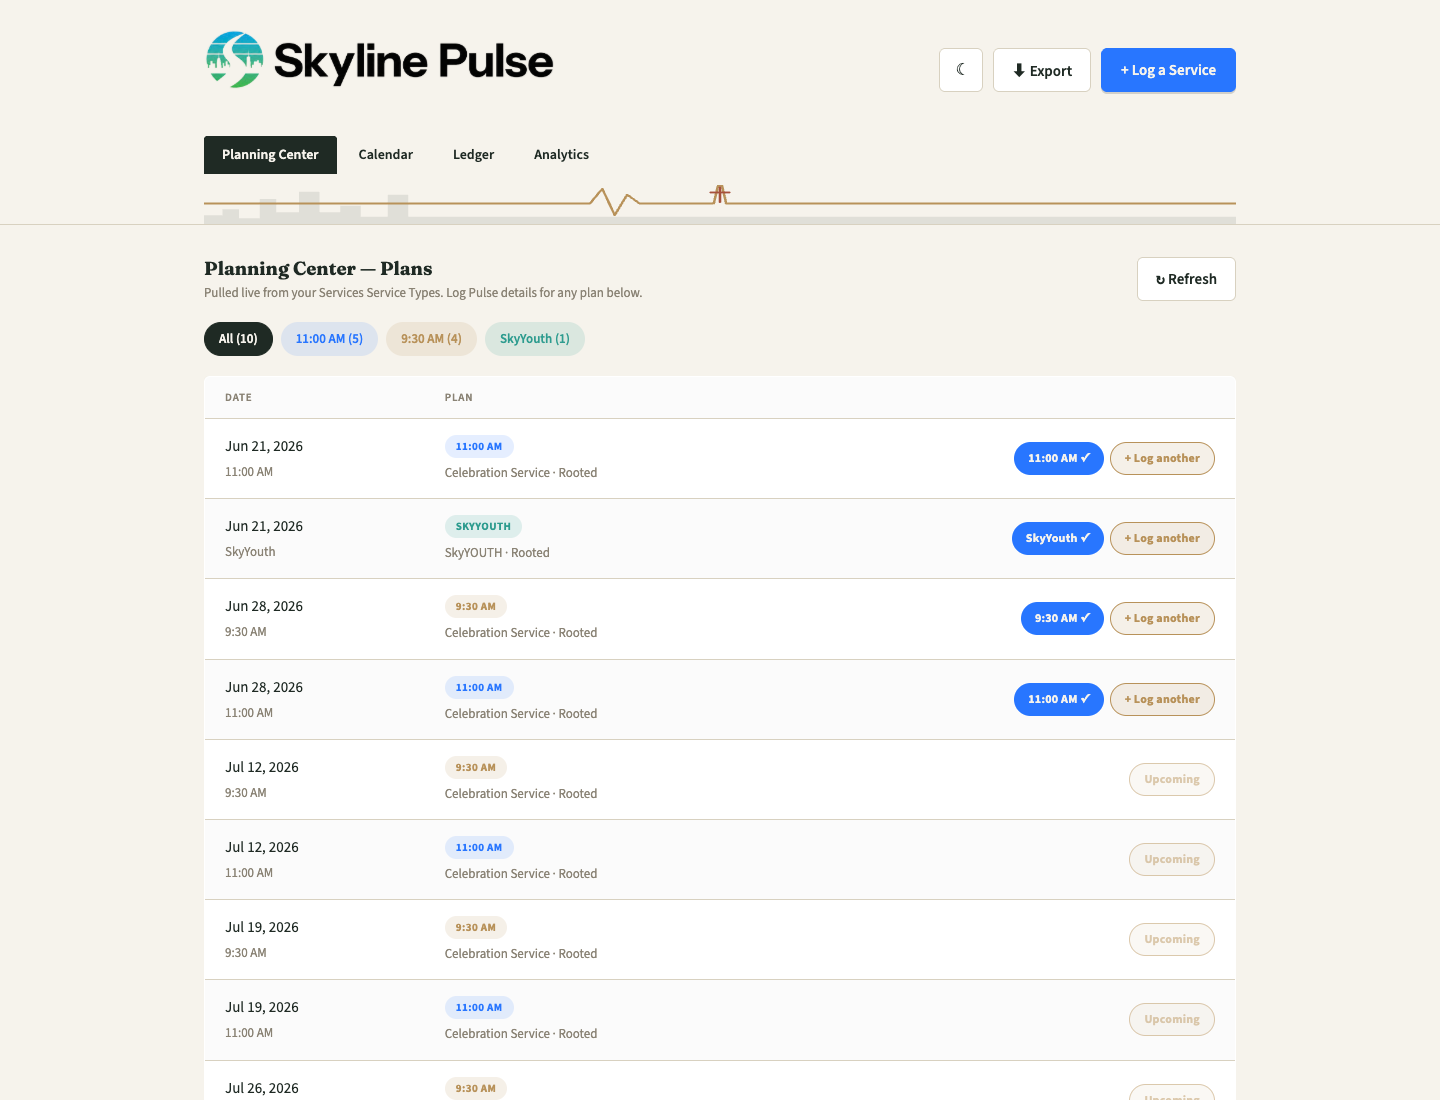
Plans pull automatically from your Services Service Types — including sermon artwork, split 9:30/11:00 service times, and attendance headcounts from Check-Ins — so nothing's typed twice.
SkyYouth gets its own Planning Center feed, ledger, and analytics — pulled from its own Service Type, never mixed in with Sunday morning.
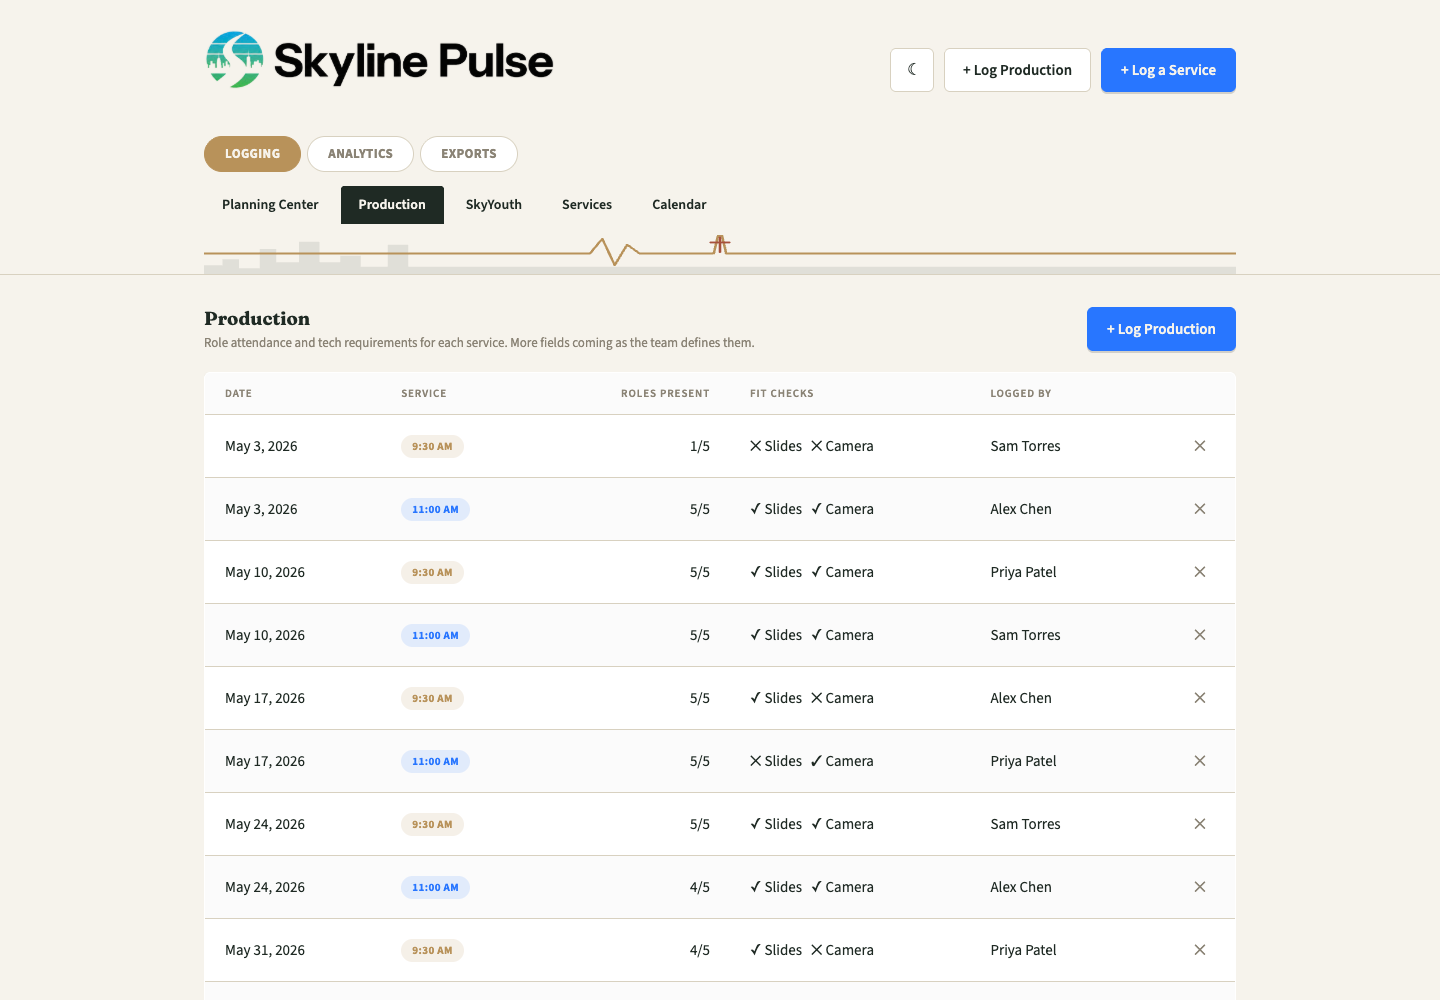
Role attendance for lights, camera, director, computer/ProPresenter, and audio, plus a graded (1–4) slides fit-check with a miss count — feeding a Slides Leaderboard for who's sharpest on cues.
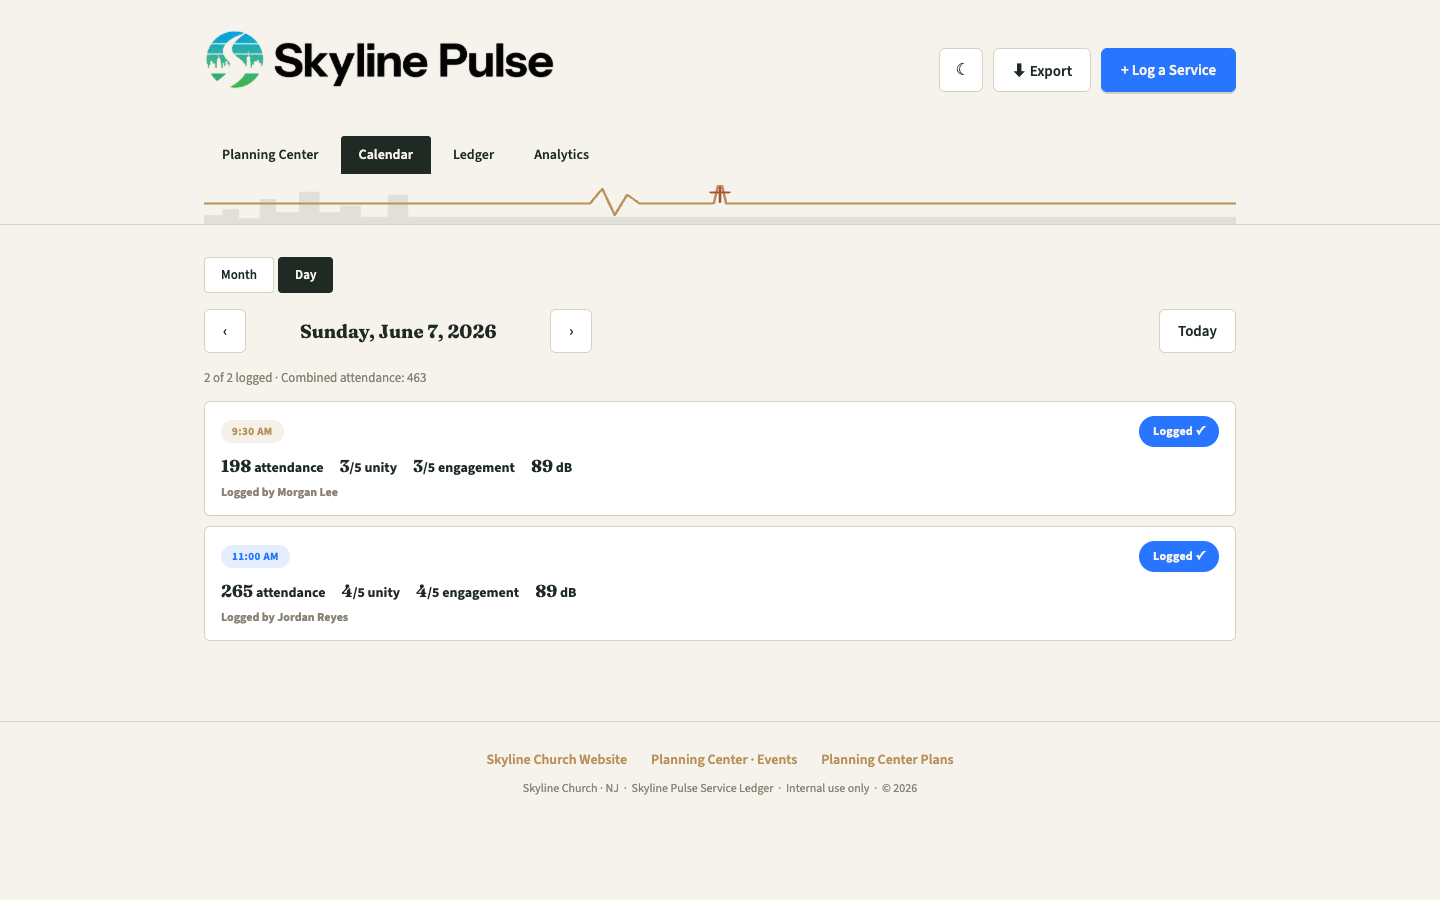
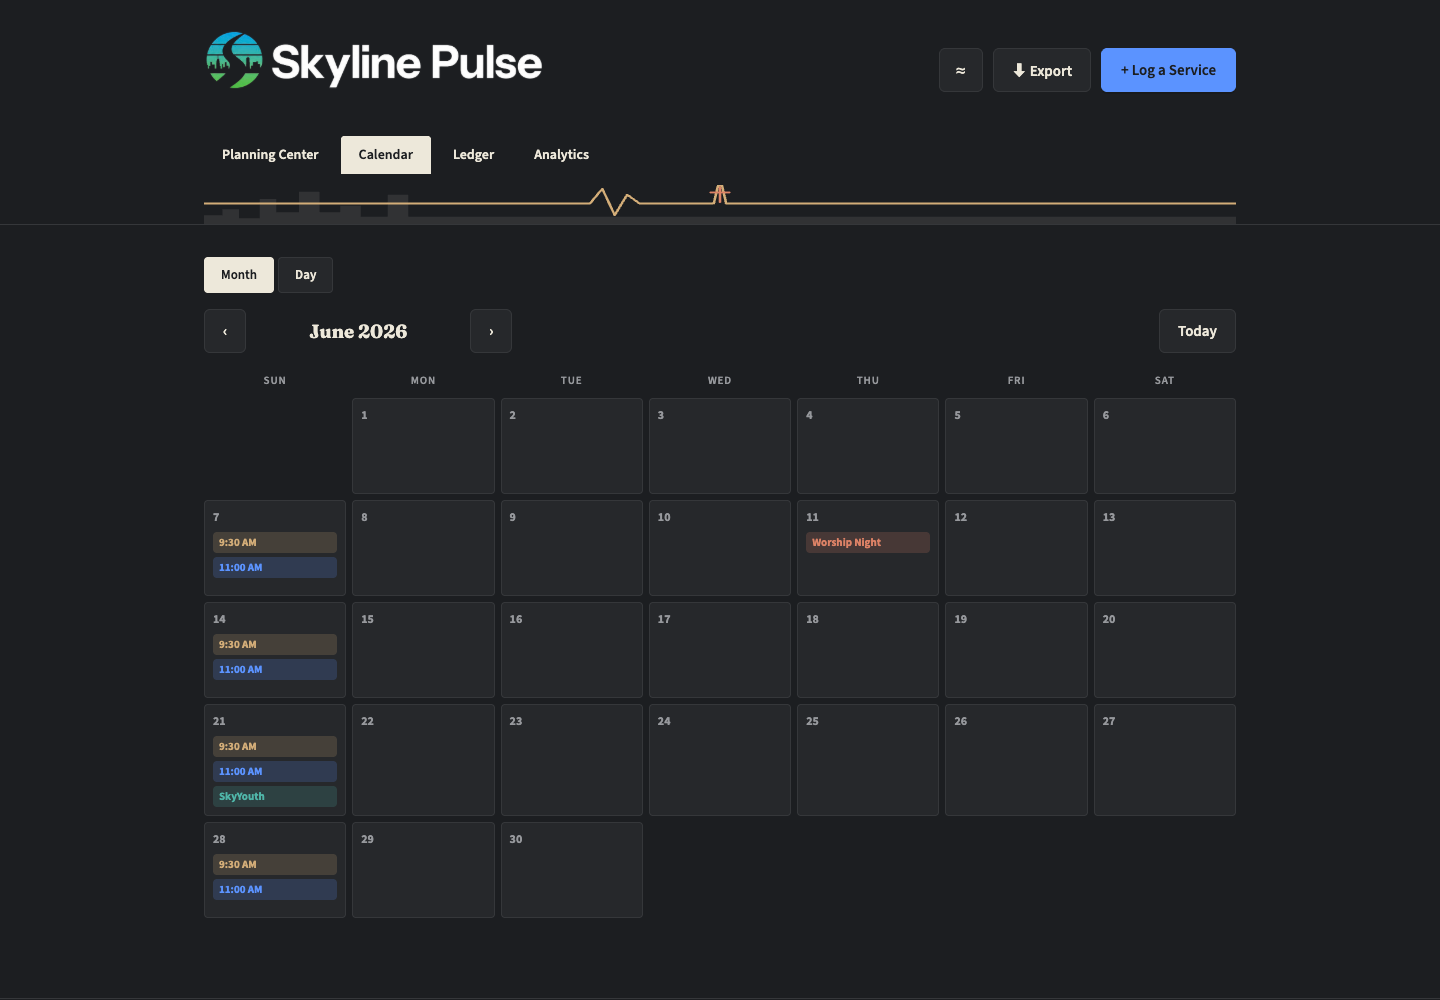
See exactly what's logged and what's still needed for any Sunday, at a glance — month grid or a focused day agenda.
A lightweight "Logged by" field, autocompleted from names used before — attribution without a login wall.
Sound clarity, spiritual response 2/3 back, transition clarity, and whether lighting, talking, announcements, and the sermon landed as planned.
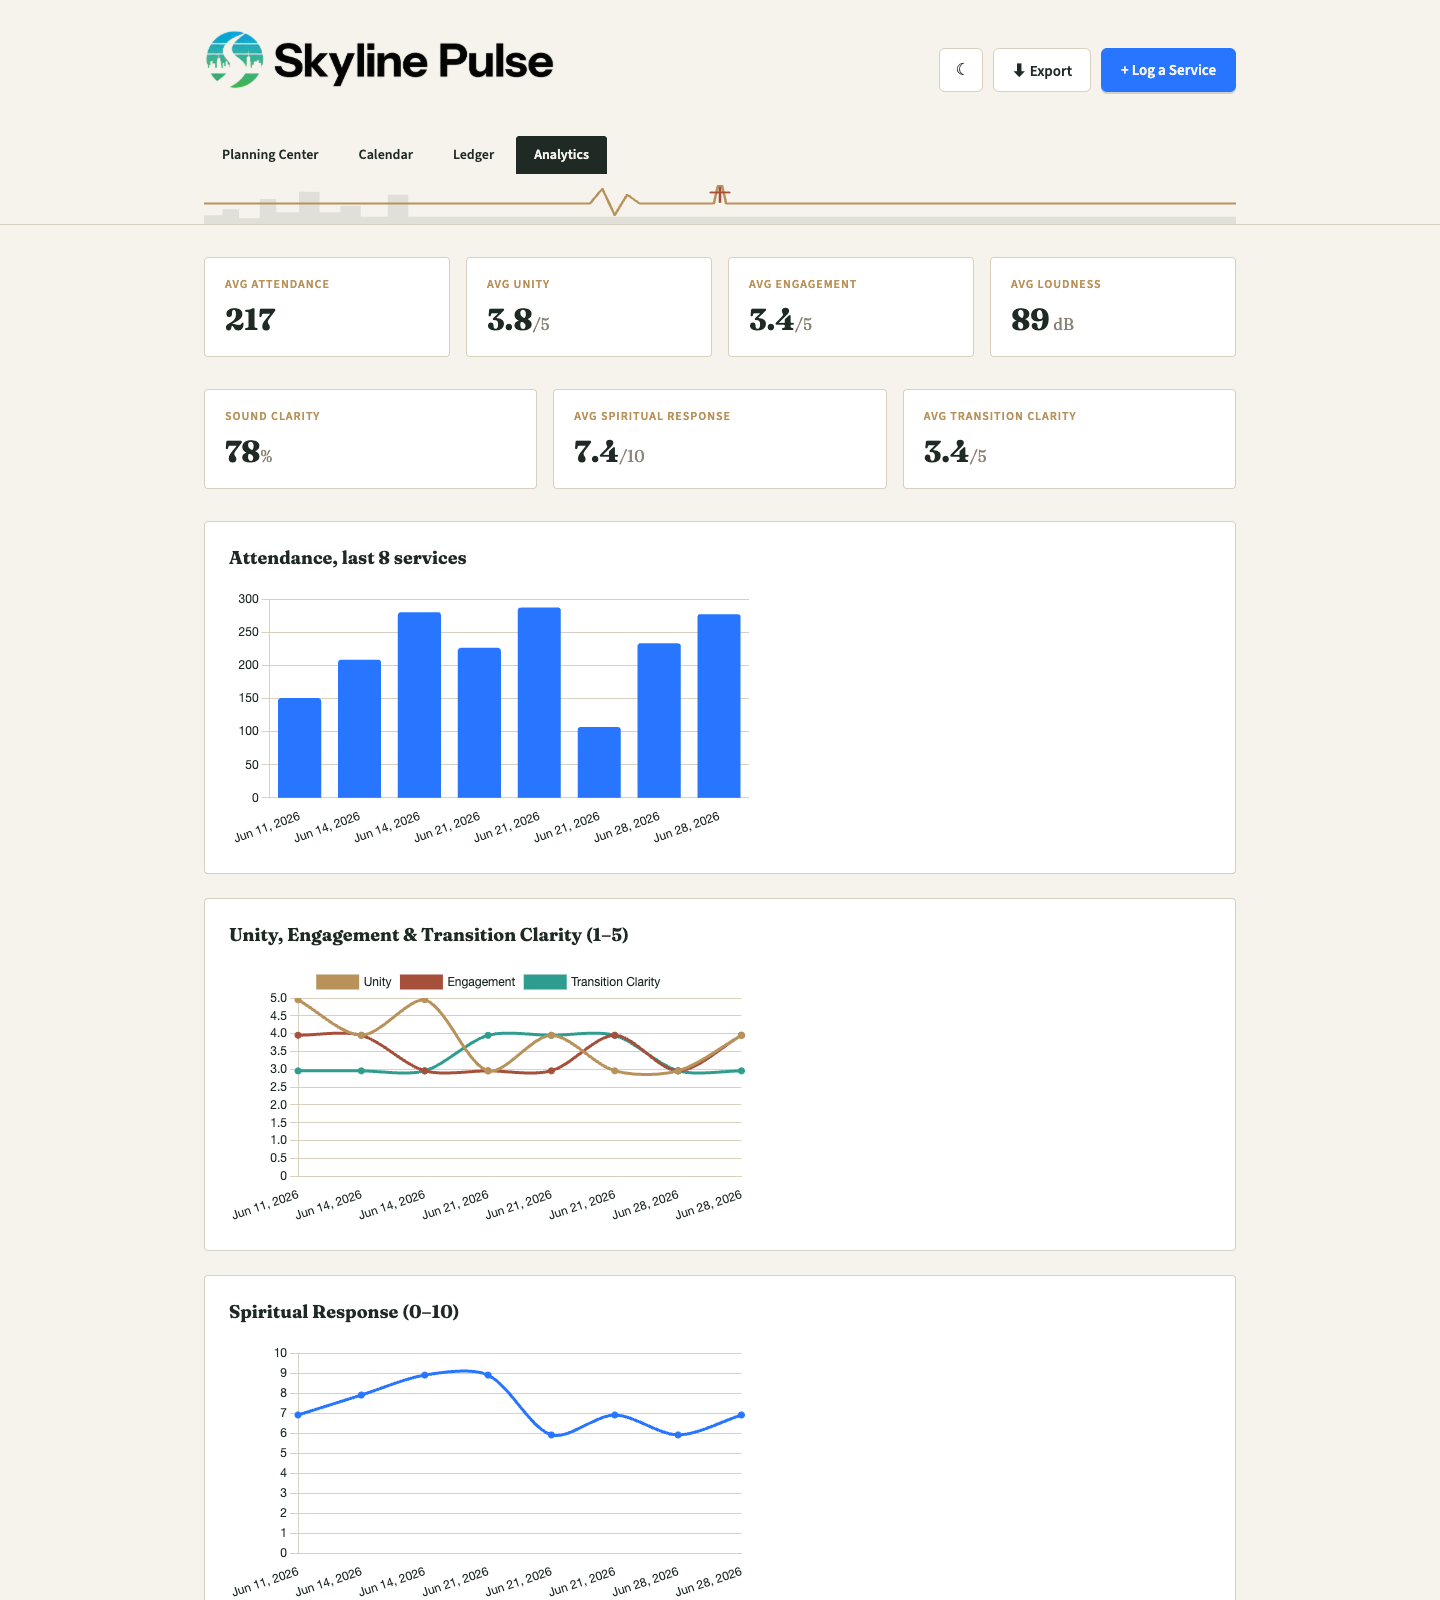
Services, Production, and SkyYouth each get their own trend charts and a "who's logging" breakdown, so the numbers stay honest and current.
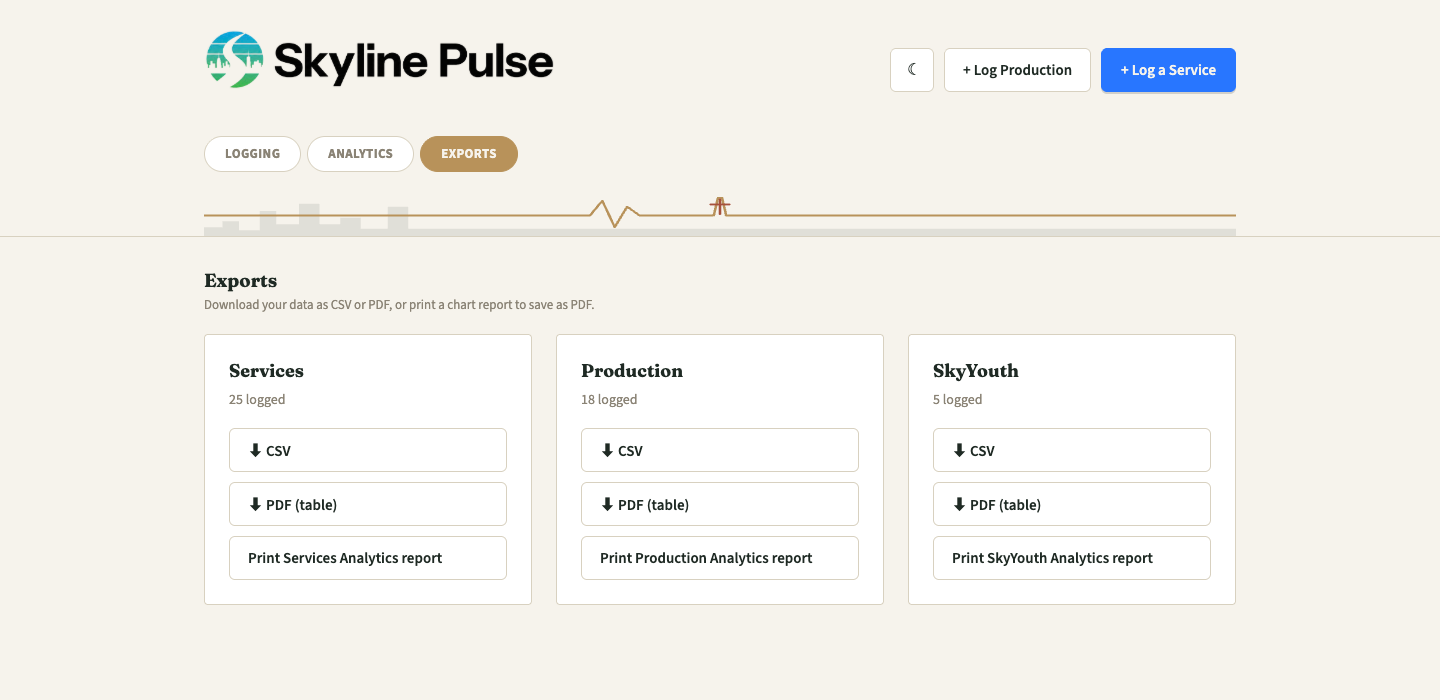
Every ledger exports to CSV or a formatted PDF table; every analytics view prints straight to a shareable PDF report.
No accounts to create, no app to install. One shared link, a name picked from a list, and you're logging.
Pulse reads directly from your Planning Center Services Service Types — pulling every Plan in a rolling window, matching it to a Pulse service type, and showing sermon artwork when it's attached.
Its own tab, its own ledger, its own analytics — role attendance for lights, camera, director, computer/ProPresenter, and audio, plus a graded slides fit-check that turns into a friendly leaderboard for the team.
Switch between a full month grid for planning ahead, or a focused day view built for the main event — Sunday morning — showing every logged detail per service in one scroll.
Attendance and loudness up top, then room experience and service flow below — each field designed around a real conversation the team already has after service.
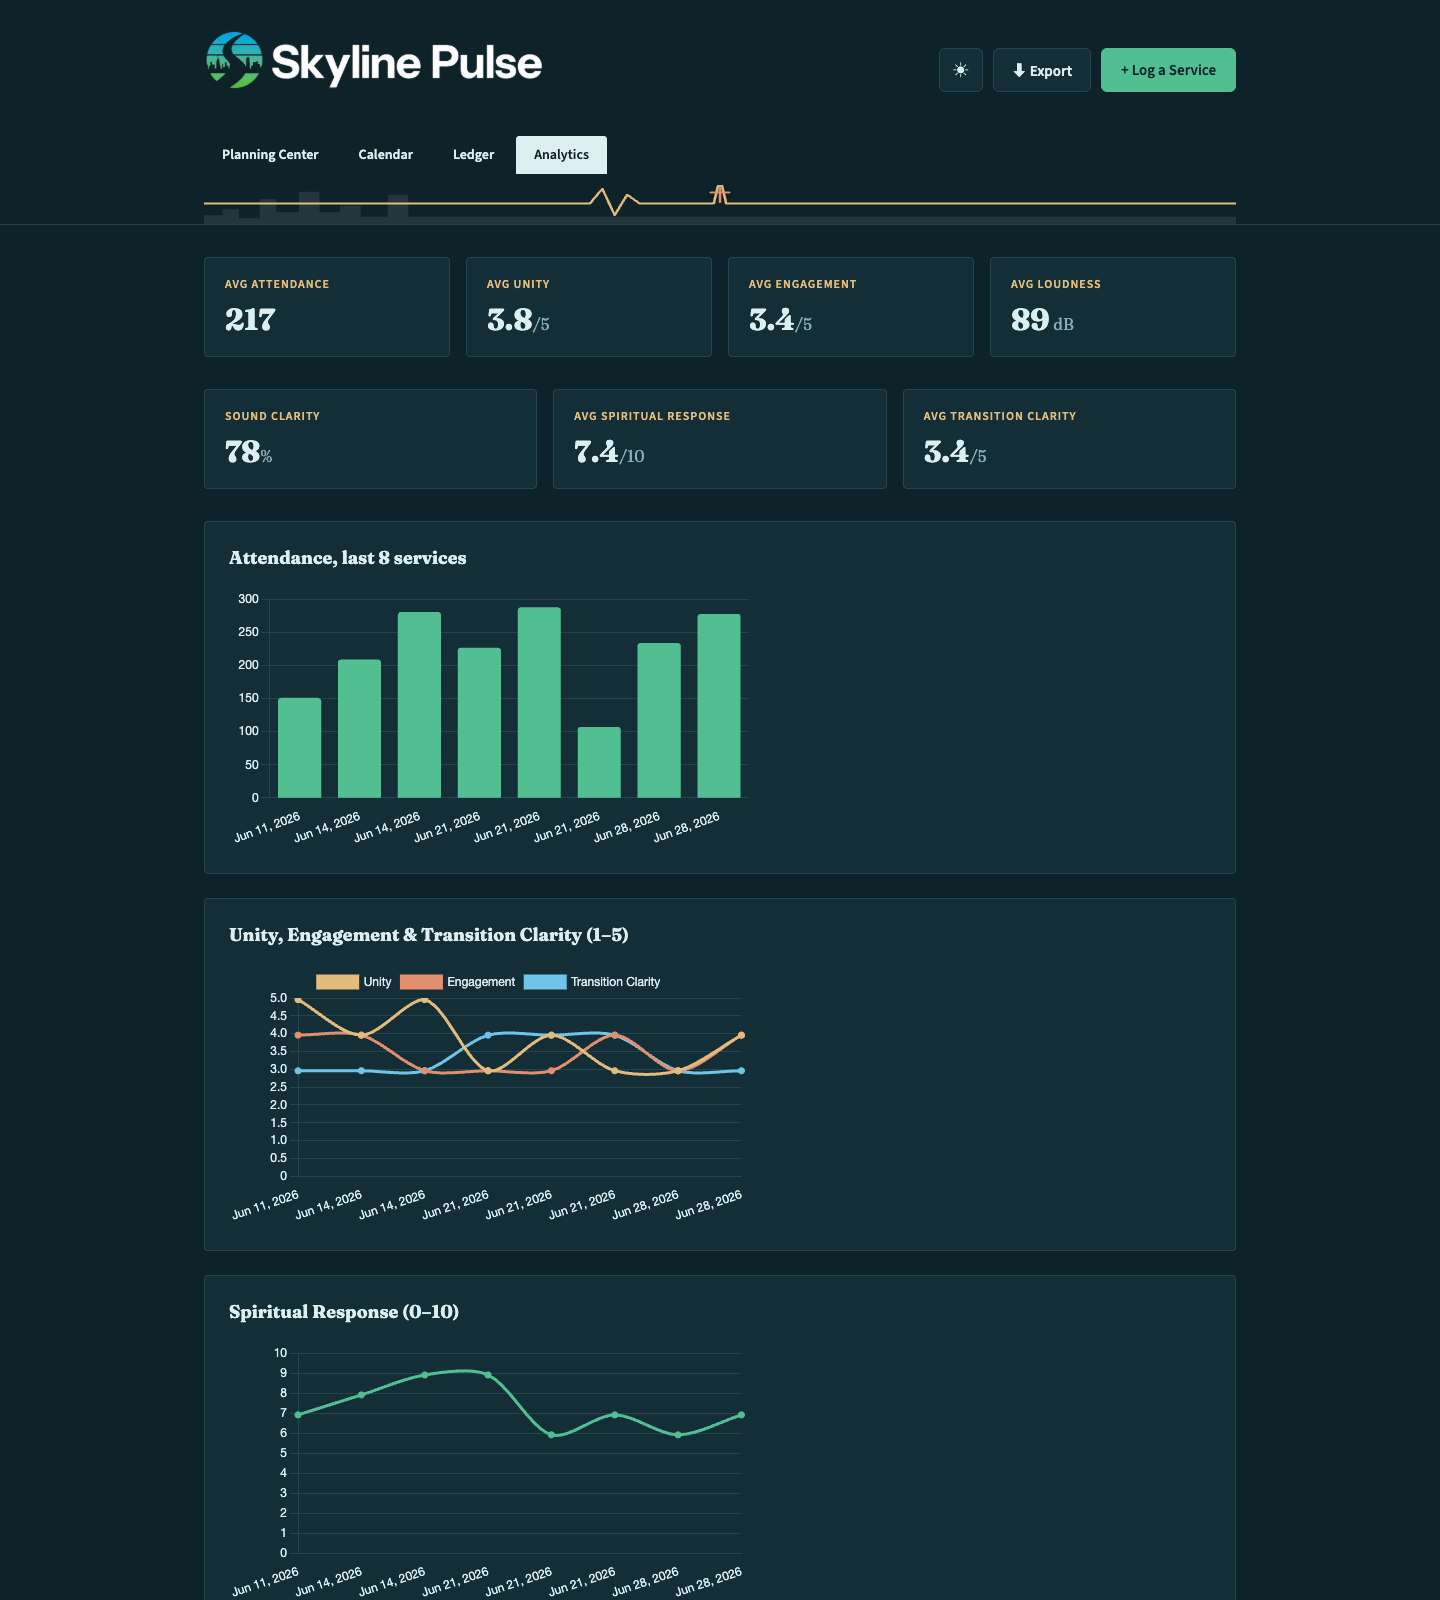
Services, Production, and SkyYouth each get their own tab under Analytics — every measurement charted over time, plus a breakdown of who's been logging, so the numbers stay accountable.
A dedicated Exports page with a card per dataset — Services, Production, SkyYouth — each offering a CSV download, a formatted PDF table, and a one-click print of that dataset's Analytics report.
Pick a theme and Pulse remembers it on that device — including a full re-tint of every chart.
One HTML file. No build step, no framework, no server to maintain beyond what's already free-tier.
Postgres + Row Level Security as the backend, called directly from the browser.
Static hosting with auto-deploys on every push to main.
A small serverless proxy keeps the Planning Center API token off the client entirely.
Every analytics chart, themed live from the same CSS custom properties as the app.
Tabular PDF exports for the client; report-style PDFs use the browser's own print-to-PDF instead of a library.

